The RTA - Realtime Analyzer is one of those tools any professional audio engineer must know in great detail. It measures and displays the frequency spectrum of an audio signal and presents it as a row of bars, typically 3, 6 or 12 pr. octave, and can help you focus on parts of the sound that could otherwise be hard to detect.
It also lets you zoom in - for example on those frequencies representing human speech.
|
Sign up to learn about new blog posts! |
|
|
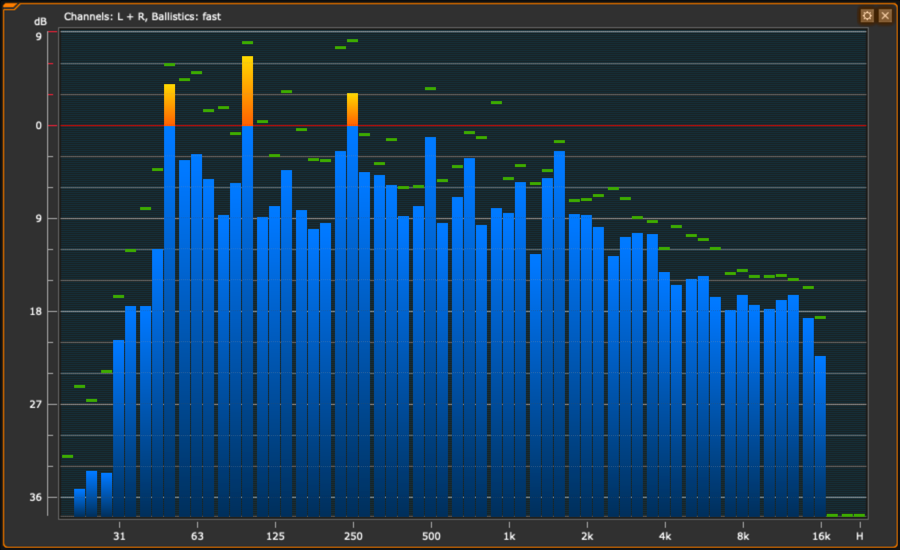
What you hear is what you see
The human ear does not perceive different frequencies with the same acoustic pressure equally loud, and to compensate for this, you can select different standardized weighting filters – typically the so-called A-filter.
These filters mimic the way the hum ear perceives the loudness of the sound so the RTA can display a visual representation close to what you hear.
Horizontal Axis
The RTA has a horizontal axis that shows the frequency range. The standard frequency range would be from 20Hz to 20 kHz. This is the typical range that the human is able to detect.
However, if you are only interested in the Low Frequency range, you can configure the RTA axis to start at 5 Hz and end at 5 kHz, which provides a higher resolution for this frequency span as well. For example, almost all parts of human speech are covered within this range.
For special applications, you can extend the 20 kHz frequency range with the H-band that even shows summed audio content above 20 kHz. You can set the resolution of the RTA to 1/3 octave, 1/6 octave or with the latest firmware release for TM7 and TM9 even to 1/12 octave.
The Horizontal Axis
|
|
|
|
The vertical axis shows the resolution in dB. You can select 3, 6 or 9 dB as the resolution. In this way, you can define the range of the displayed audio signals. To add a reference point to the display, a value between -18dB and +21dB can be set in the configuration menu. |

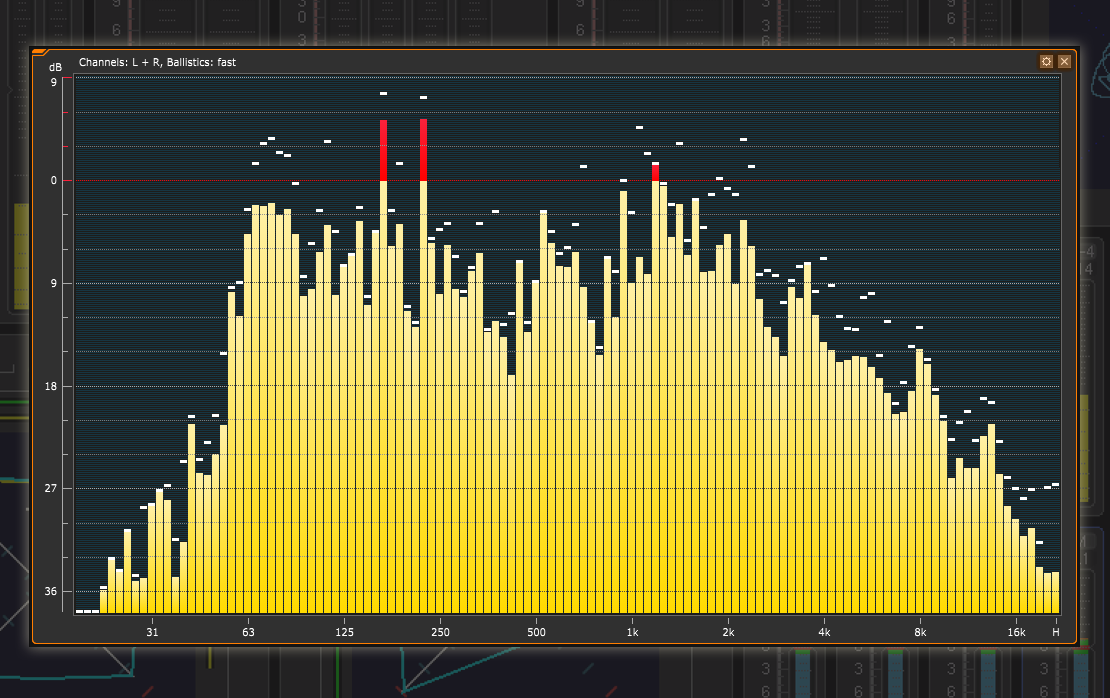
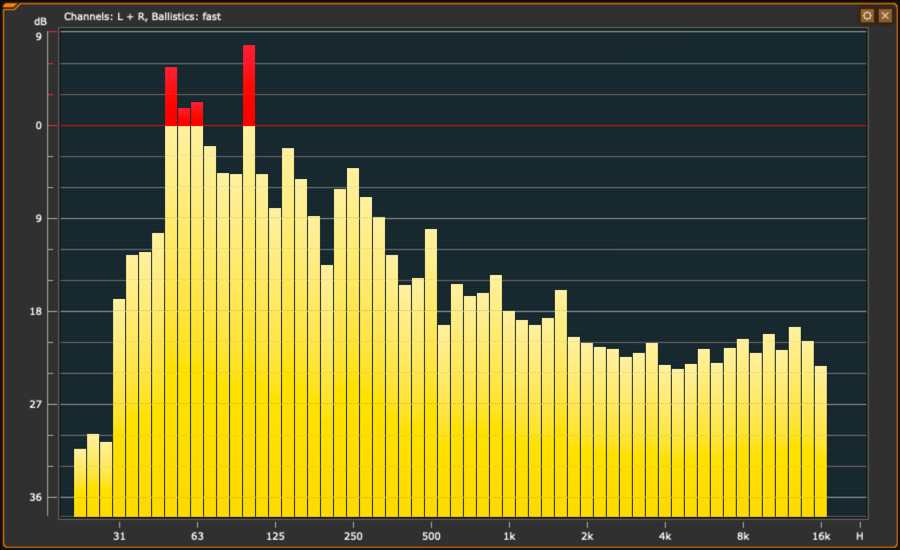
Peak Hold
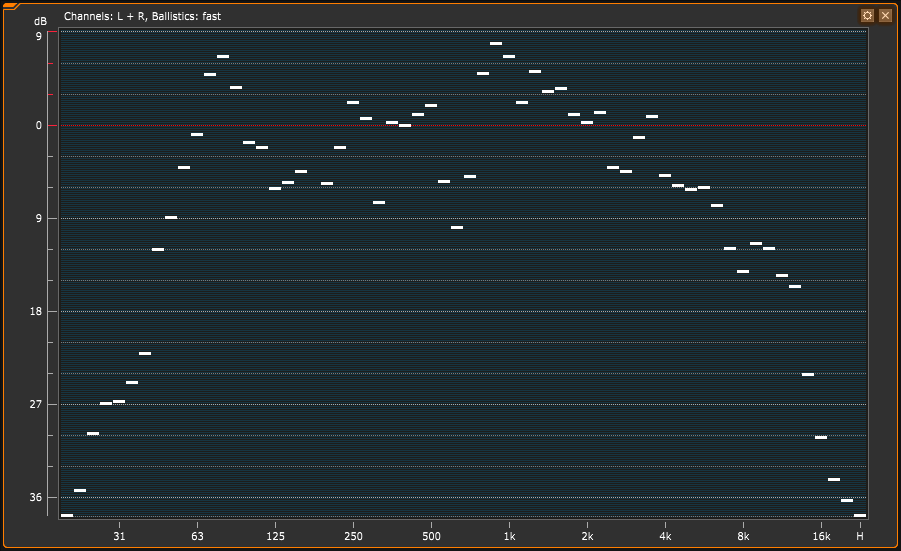
Here you see the white Peak Hold indicators.
Peak Hold can be set for all bars in common, or each bar individually.
You can choose to set an automatic hold time between 0 (off) and 30 seconds, but you can also choose to reset the peak hold bars manually using a switch.
In this image the peak hold indicators are white, but you can set the colors as you like.
Reference Point
You can set a reference point to indicate if the levels are above a certain threshold. The point can be set from -18dB to +21dB.
Bar Layout
The bar layout can be changed in a number of ways to make it easier to read in various conditions.
You can adjust the layout to display the bars in groups or even as a block, and you can pick between a number of color schemes. Whatever suits your individual need.
Bar Layout: Single
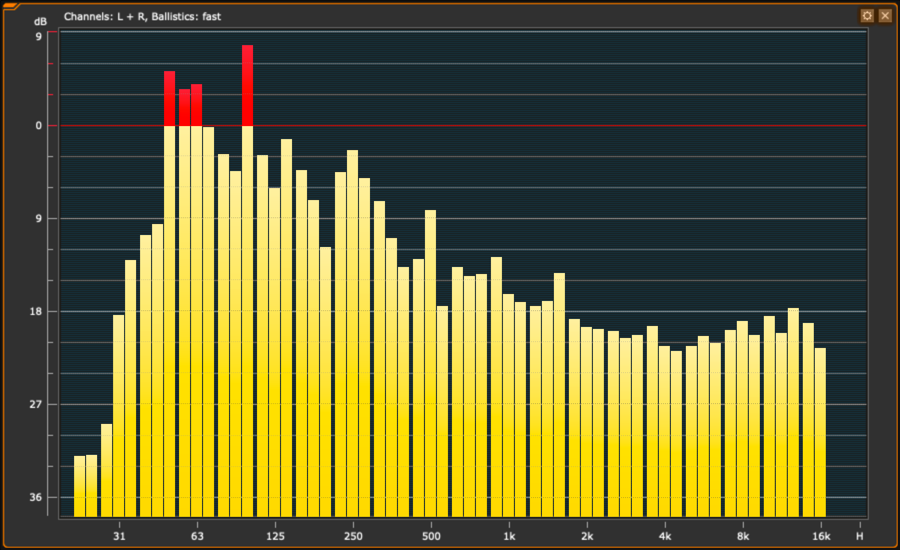
Bar Layout: Groups
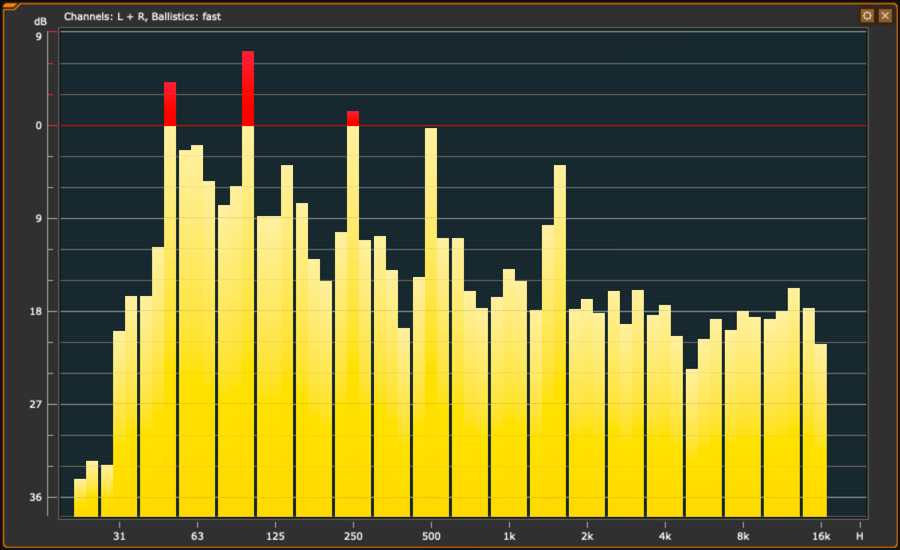
Bar Layout: Blocks
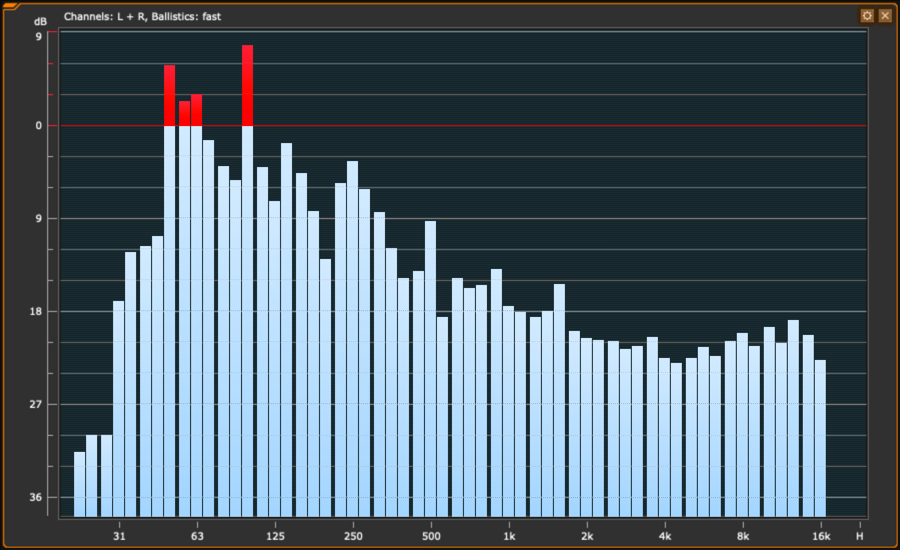
Bar Layout: Blue
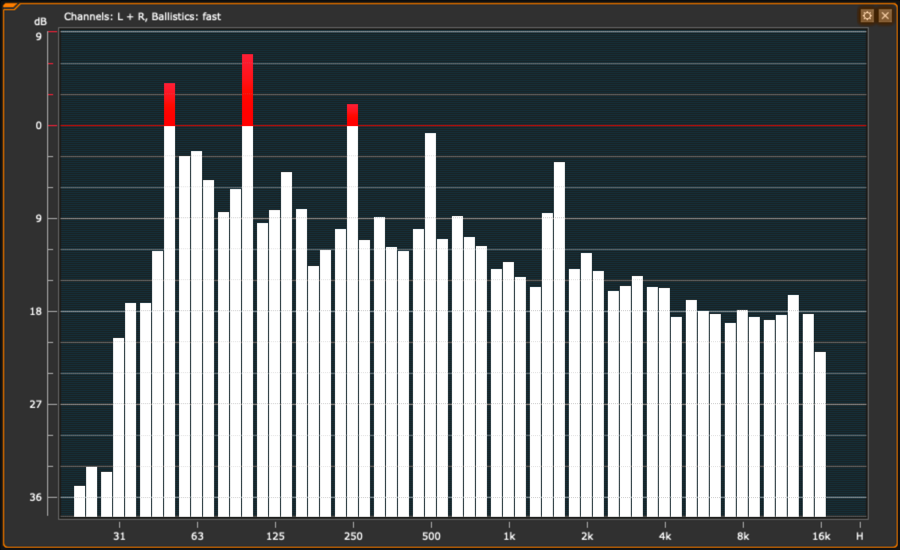
Bar Layout: White
Bar Layout: Funky
|
Sign up to learn about new blog posts! |
|
|
Practical Use
- Keep an eye on the general spectral aspects of your audio
- Check for anomalies, such as low-end background noise
- Display frequencies outside human hearing range or outside the frequency range of your speaker system
Technically Spoken
What is required to run RTA?
- RTW TouchMonitor TM7 or TM9
- Software license SW20003 RTA - Real Time Analyzer
- In case you need to work with multichannel material, you need software license SW20001 Multichannel Mode
The RTA is also part of the RTW Mastering Tools plug-in for Mac and PC.
RTA - Real Time Analyzer Features
|
|||
| Funktions: |
|
||
| Input Sources: |
|
||
| Frequency range: |
|
||
| Number of bands: |
|
||
| Weighting filter: |
|
||
| Peak hold indicator: |
|
||
| Measuring range: |
|
||
| Scaling: |
|
||
| Integration time (ballistics): |
|
||