Thomas Valter • Director of Product Management, RTW
June 4, 2025
As surround and immersive formats continue to replace stereo in cinema, broadcast, and music production, new tools are needed to help audio professionals understand the spatial behavior of complex mixes.
At the 2025 AES European Convention in Warsaw, RTW’s software engineer Pavel Smokotnin introduced a novel visualization approach to tackle exactly this challenge: The Polarscope.
The Polarscope is included in the Immersive license for TMxCore, read more here.
The Problem: Stereo Tools Fall Short in a Surround World
Traditional stereo analysis tools – such as vectorscopes – work well for two-channel mixes but fall short when applied to multichannel formats like 5.1 or 7.1. With multiple audio sources spread across space, detecting phase errors, spatial coherence, and directional balance becomes far more complex.
Pavel’s research asks:
"What if we could adapt these familiar visualization tools to support surround and even immersive audio?"
The Method: A Spatial Vectorscope for Surround
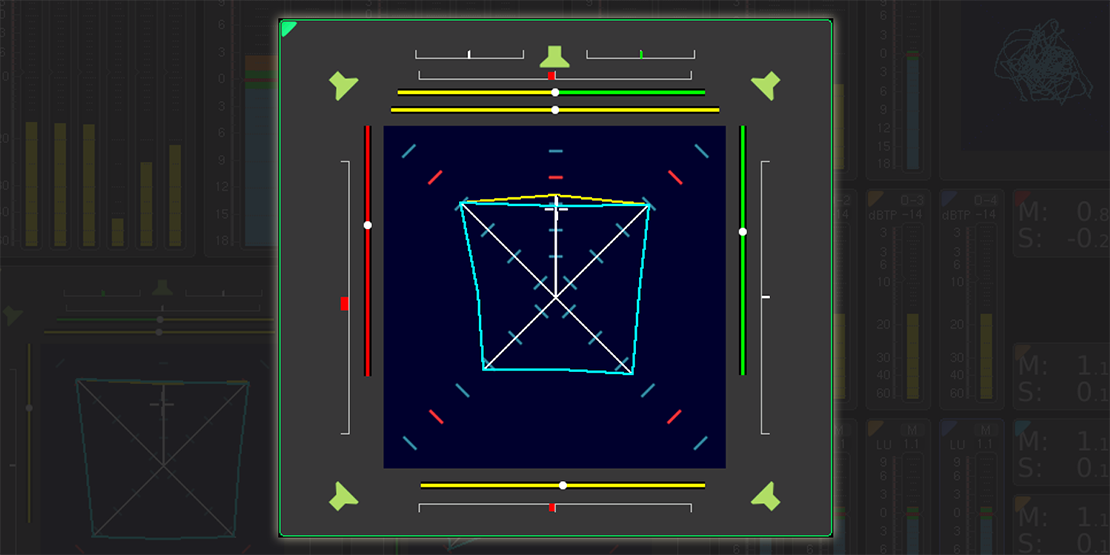
Inspired by the classic vectorscope, Pavel developed an algorithm that visualizes interchannel correlations using a spatially aware coordinate system. Each speaker’s position is treated as a vector in space, and the signal levels are used to calculate real-time shapes on screen.
In stereo, a shared signal forms a vertical line, while polarity inversion creates a horizontal one. The new method extends this concept to surround layouts, where signal combinations form distinct geometric shapes that reflect spatial attributes such as:
- Image width and depth
- Front/rear energy balance
- Channel delay mismatches
- Phase problems or mirror symmetry
This makes it possible to “see” how the mix behaves in space—with different shapes indicating issues or affirming spatial coherence.
Real-World Examples: What the Shapes Reveal
Using a custom software tool and test signals, Pavel demonstrated several key patterns:
- Perfect channel symmetry forms clean vertical lines.
- Polarity inversions or delay mismatches tilt or distort those lines.
- Uncorrelated noise produces a “cloud” shape, revealing spread and depth.
- Real program material, like dialogue scenes, narrows the shape toward the center channel, while storm scenes form diffuse shapes that follow sonic motion.
Importantly, these visual cues correspond to human perception, offering a new way for mixing engineers and QC operators to detect and optimize spatial behavior.
In the following video you can directly follow what is described. The montage shows the underlying movie with 5.0/5.1 audio and the recorded Polarscope measurement sequence in one.
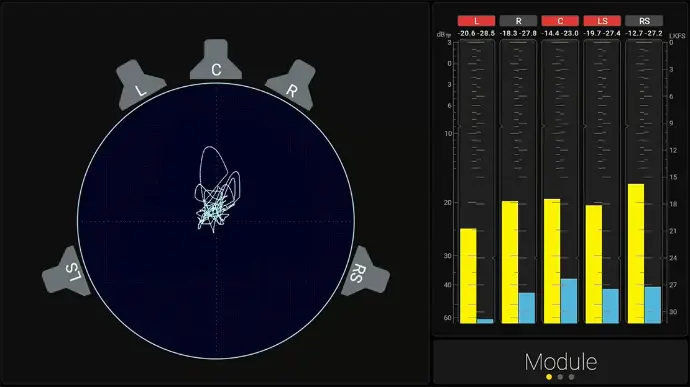
Comparison to RTW’s SSA Tool
Pavel’s approach complements RTW’s Surround Sound Analyzer (SSA), which visualizes momentary loudness across speaker positions using a pentagon-style layout. While the SSA focuses on loudness distribution, the proposed method reflects phase and correlation dynamics, offering a different yet compatible insight into spatial structure.
Immersive Measuring
The analysis of surround and immersive audio requires tools that not only measure but also visualize spatial relationships in a way that reflects what we actually hear.
RTW’s suite of immersive metering instruments brings this capability to life, giving sound engineers immediate insight into the spatial balance, phase relationships, and overall integrity of their mixes. They are available as a license option.
Conclusion
With immersive audio on the rise, engineers need tools that match the complexity of the formats they work with. Pavel Smokotnin’s surround visualization algorithm marks an important step forward—bridging the gap between what we hear and what we can see.
Explore the full white paper in the AES E-Library.
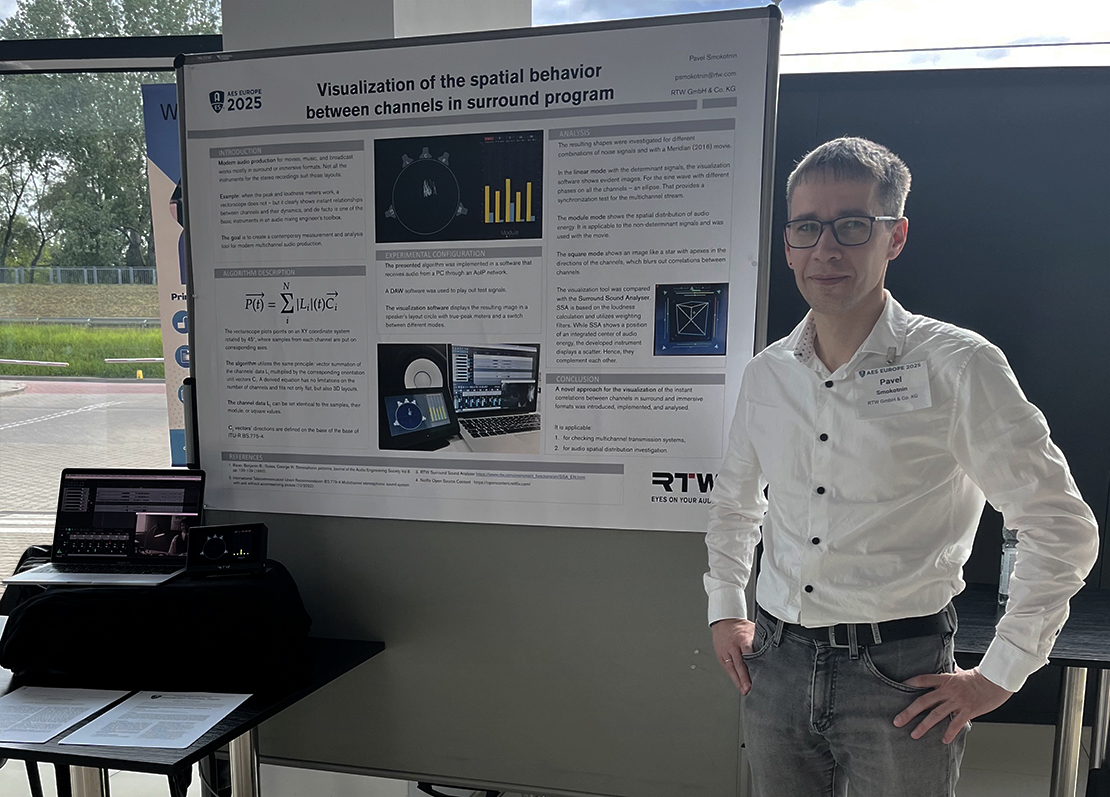
Pavel Smokotnin, Research and Development, RTW, presents his approach at the AES