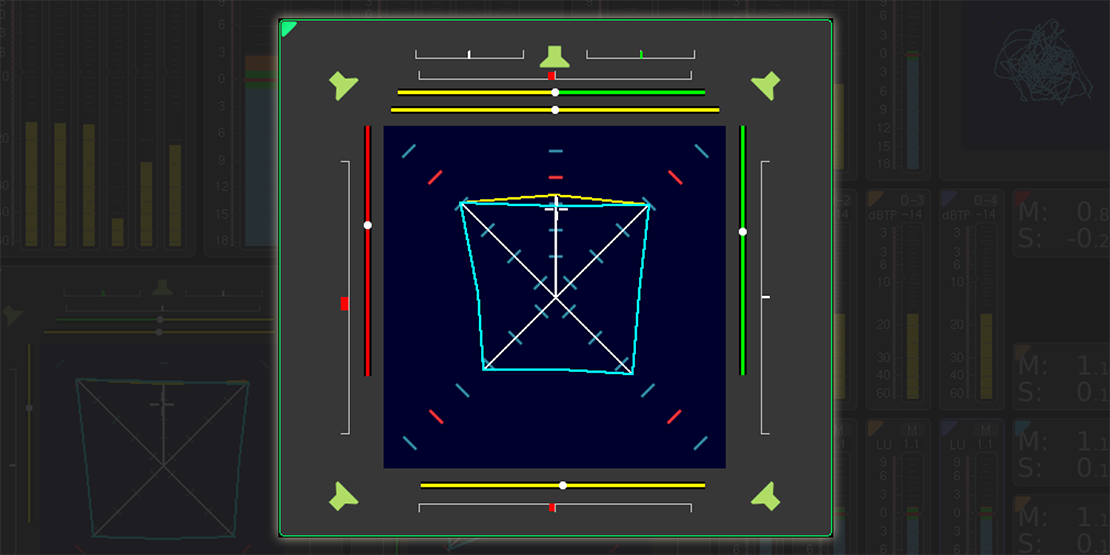
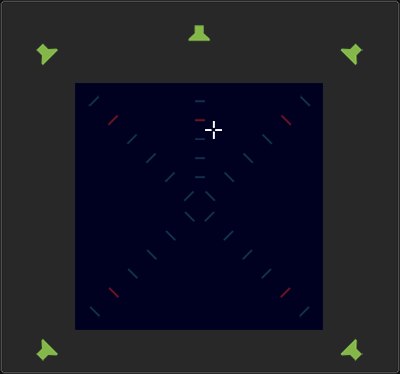
Complete Display
Unique to the TouchMonitor, the Surround Sound Analyzer is a pioneering and unique visualisation tool showing the relevant technical and subjective parameters of surround signals in a fast and intuitive way.
The Surround Sound Analyzer displays a correctly-scaled graphical representation of the relative volumes in the surround sound field.
The interaction of levels (volume, sound pressure level or loudness) and the correlation of all channels in the overall surround sound is displayed graphically, providing a very clear overview. The graphical display has been carefully designed so that the dynamic behaviour of all display elements corresponds to the subjective listening impression, showing the balance of the surround program intuitively and at a glance.
The examples in this article will be based on standard 5.1 audio, but the SSA can be set up to work with signals from stereo all the way up to 7.1 surround.
Short video clip showing the behavior of the Surround Sound Analyzer
|
Sign up to learn about new blog posts! |
|
|
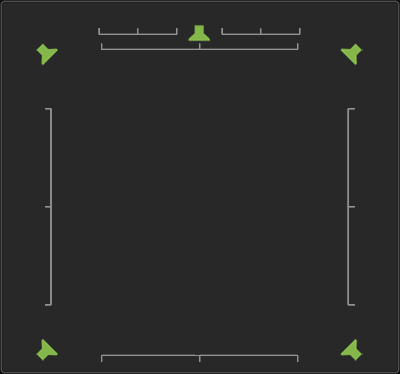
Phase Relations Between Channels
Let's first have a look at how phase relations are displayed.
The SSA is able to show the main phase relations between channels in a surround mix, and on the image here I have isolated the bars that show just that.
The phase correlation between LS and RS surround channels is of particular importance, because phase errors on those two channels lead to very blurry, unfocused surround images.
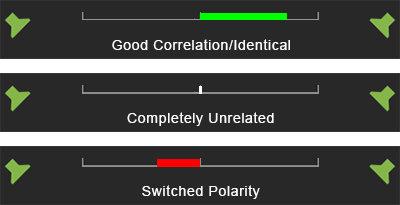
The lines between speakers are traditional phase correlation meters. They compare the signals in the two channels and display the correlation between them, from good correlation over unrelated to switched polarity, as you see on this image:
Phantom Source Indicators (PSI)
Like the phase correlation bars, the Phantom Source Indicators show relations between each of the channels in a surround mix.
They show three things: the perceived position, the spreading and the phase correlation.
The perceived position is shown with a white dot that moves according to how the position of the signal is perceived by the listener.
The spreading, or stereo width, is shown by the length of the bar. If the audio is close to mono, the bar will be short, and if there is a wide stereo image, the bar is long.
The Phantom Source Indicators take color according to the phase correlation: Good: Green, Unrelated: Yellow, red: switched polarity.
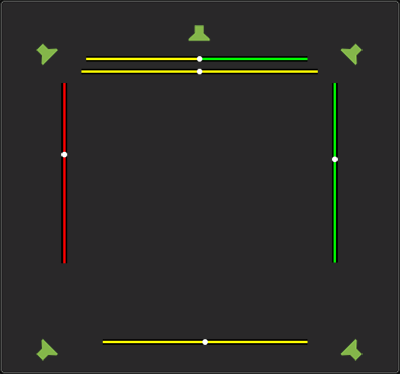
Here are some examples of how the Phantom Source Indicators can look like, and what it means:
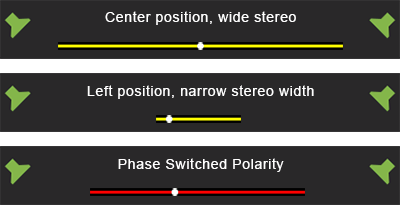
Total Volume Indicator (TVI)
The Total Volume Indicator displays the total volume and balance of the audio material in a single view.
The length of the lines that go out from the middle position show the sound pressure level or loudness of each single channel.
The red ticks on the scales indicate your pre set reference point. If you are working according to a loudness standard, you can set the reference point to your loudness target, 0 LU and thereby always keep an eye on how your work is performaing according to the loudness target.
If you work with acoustics levels, you can set the reference point to indicate your optimal listening level, for instance 83 dB SPL to make sure you are working at the right level. Obviously, this requires your studio to be correctly calibrated.
Center Channel Level
The balance between the Center channel and Left and Right front channels is generally a critical parameter for surround programs.
For this reason the Center channel is presented with its own display elements showing volume differences between the Center channel and the L and R channels very clearly.
Dominance Indicator (DMI)
The Dominance Indicator displays the position of the subjectively perceived acoustic focal point.
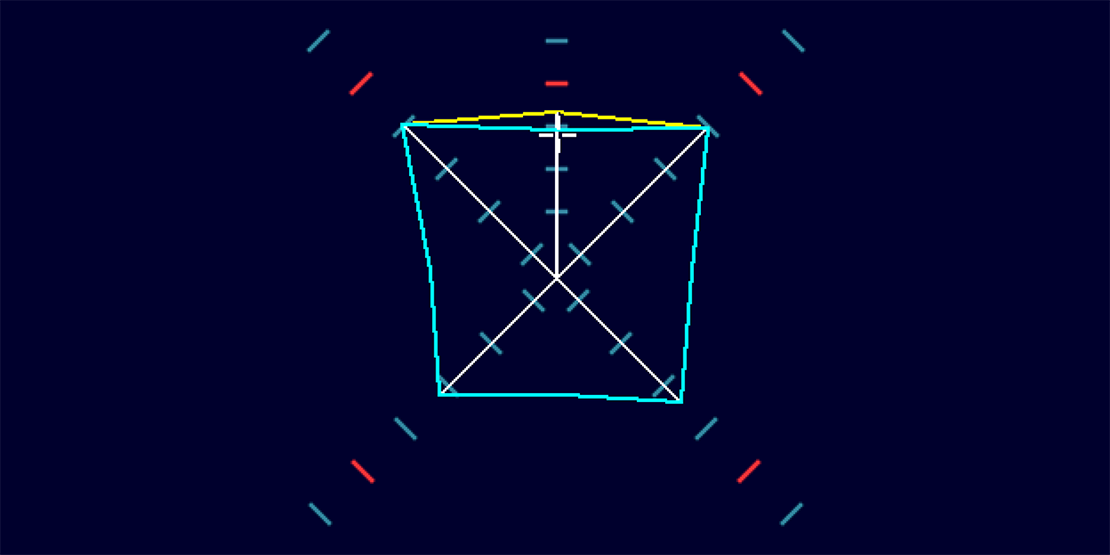
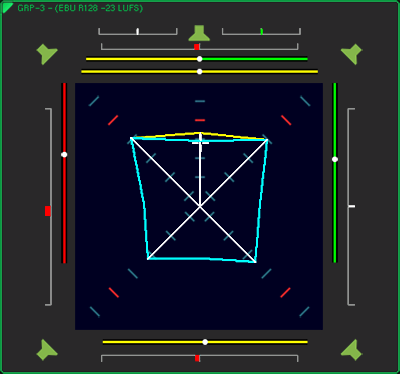
Full View
In the Surround Sound Analyzer all the components mentioned above are displayed in one easy-to-read view.
The Surround Sound Analyzer display is based either on loudness standards or SPL. With SPL it reflects the listening sound pressure level with a properly calibrated studio monitoring system.
Practical Examples
Let's take a look at some practical examples to see how the SSA displays various audio examples.
In this first example, we play incoherent noise (signals with no phase relationship) with the same level in the 4 channels L, R, LS and RS.
L, R, LS and RS are set to the reference monitoring sound pressure level.
Between each channel, the correlation is r = 0 (unrelated), which means you see straight unbroken cyan colored TVI (Total Volume Indicator) lines and straight yellow PSI (Phantom Source Indicator) lines.
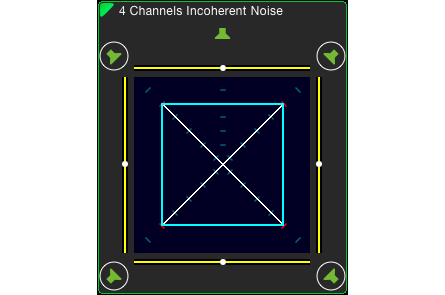
4 Channel Noise
In this example we play identical sine wave signals with same level in the 4 channels L, R, LS and RS.
Correlation is r = +1 (identical), which means that you can see outward broken cyan TVI lines.
The phantom sound sources (PSI) lines are very narrow so you can not see them, and they are in the middle, similar to a mono signal.
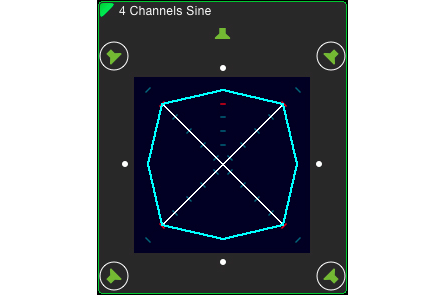
4 Channel Sine Wave
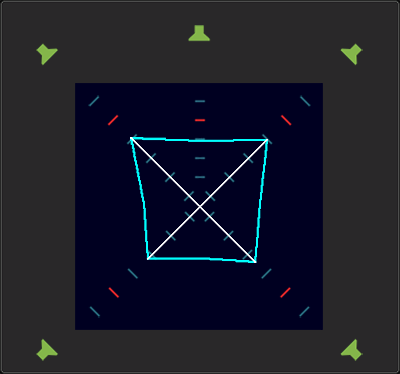
Next we play the same as in the example above, BUT with the left channel phase rotated 180° (phase inverted).
Because there is now a negative correlation r = -1 (switched polarity) between L-R and L-LS, you can see that both the L-R and L-LS cyan TVI lines are inward broken.
The negative correlation is also shown by the PSI bars, which have now turned red.
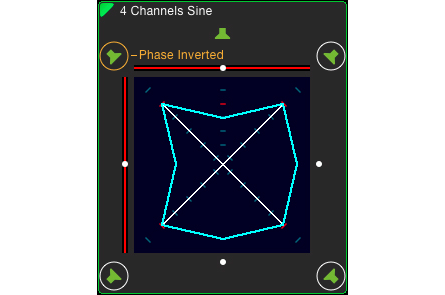
Left Channel Inverted
Here you see a surround signal with some center presence.
The center presence is displayed by the yellow "roof" on top of the square cyan TVI polygon. As you see, there is a real signal present in the center channel, and it is a bit louder than the ambient signal.
The width of the green/yellow PSI bars of the center channel is a sign of coherent signal parts in L and/or R (crosstalk).
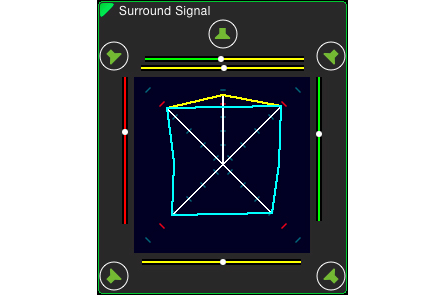
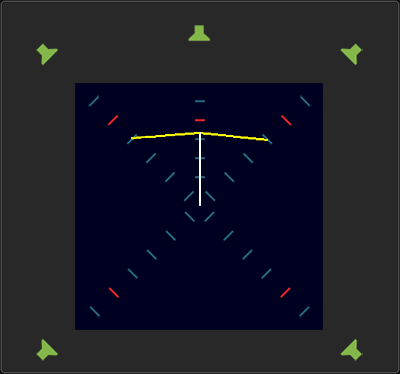
Surround Signal with Center Presence
Surround signal with low level center presence.
Because of a low center level, the "roof" from the previous example now turns downwards.
If you are working with dialog in the center channel, an image like this should alarm you, as it indicates that the dialog is too low compared to the ambience.
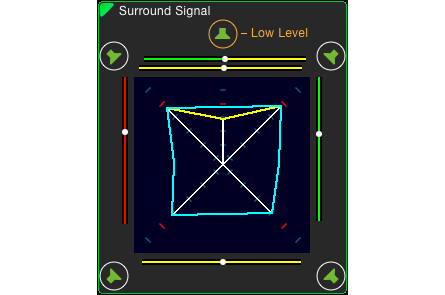
Surround Signal with low Center Presence
Identical signals in LS and RS.
The widely outward cyan TVI line between LS and RS and the zero width PSI bar indicates that identical signals are present in the LS and RS channels.
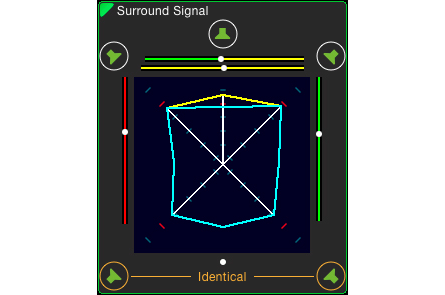
Identical LS and RS
|
Sign up to learn about new blog posts! |
|
|
Practical Use
- Keep an eye on the overall surround image balance
- Identify phase problems to make sure your audio will downmix correctly
- Check stereo width and perceived position between each channel pair
- Check the level according to SPL or loudness measures
- Identify center channel issues
- Be warned if the LFE channel has correlation problems
Technically Spoken
What is required to run SSA?
- RTW TouchMonitor TM7 or TM9
- Software license SW20001 Multichannel Mode
- Software license SW20002 Loudness and SPL Display
- Software license SW20004 SSA
The SSA is also part of the RTW Mastering Tools plug-in for Mac and PC.
Telestream, former Tektronix®, has included the SSA as part of the audio option in the PRISM product line, valid from version 2.3 and up. Please read our Blog article.
SSA - Surround Sound Analyzer Features
- Graphical display indicating the single channel and total program loudness (Total Volume Indicator) according to user selected weighting filters (e. g. SPL or Loudness)
- Position and width of phantom sound sources (PSI)
- Phase Correlation between adjacent channels
- Separate correlators for the outer adjacent channels
- Subjectively perceived acoustic focal point with the Dominance indicator (DMI)
- LFE Phase warning (warns in case of negative correlation between any channel and LFE)