grid lines grid lines grid lines grid lines grid lines grid lines grid lines grid lines grid lines grid lines grid lines grid lines grid lines grid lines grid lines grid lines grid lines grid lines grid lines grid lines grid lines grid lines grid lines grid lines grid lines grid lines Eingestellte Kanäle, Ballistik scale scale reference point reference point red display range normal display range Peakhold Peakhold Peakhold Peakhold Peakhold Peakhold Peakhold Peakhold Peakhold Peakhold Peakhold Peakhold Peakhold Peakhold Peakhold Peakhold Peakhold Peakhold Peakhold Peakhold Peakhold Peakhold Peakhold Peakhold Peakhold Peakhold Peakhold Peakhold Peakhold Peakhold Peakhold Peakhold Peakhold Peakhold Peakhold Peakhold Peakhold Peakhold Peakhold Peakhold Peakhold Peakhold Peakhold Peakhold Peakhold Peakhold Peakhold Peakhold Peakhold Peakhold Peakhold Peakhold Peakhold Peakhold Peakhold Peakhold Peakhold Peakhold selected frequency range H band input channel selection key 9 dB key 6 dB key 3 dB key resolution normal frequency range resolution low frequency range Ballistics key Display Hold key More key


RTA (Real Time Analyzer)


The example shows the RTA in 1/6-octave mode with a Stereo signal

Move the mouse accross the display elements to get the corresponding descriptions.


Like the human ear senses an audio signal, he RTA (Real Time Analyzer) displays the spectral content of the selected input channel(s) using 31 filter bands in 1/3 octave steps, 61 filter bands in 1/6 octave steps or 120 filter bands in 1/12 octave steps. Like an oscilloscope it measures the magnitude of an input signal versus frequency within the full frequency range of the instrument.
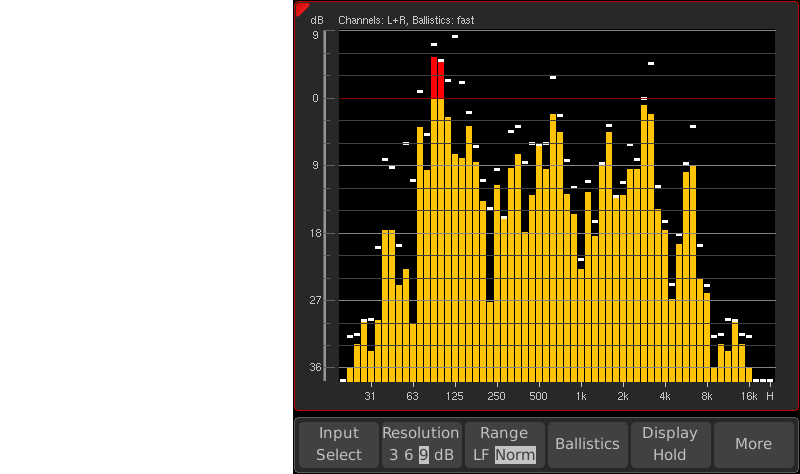
The normal frequency range reaches from 20 Hz to 20 Khz and equals the typical range a human ear can detect. An optional "H" band shows spectral signal components above 20 kHz.
Alternatively, the low frequency range (LF - 5 Hz to 5 kHz) can be switched. This frequency span providing a higher resolution covers almost all parts of the human speech.
The human ear perceives different frequencies with the same acoustic pressure not as identically loud. For this reason different standardized weighting filters can be selected. The RMS integration time is pursuant to IEC651. The RMS peak rises with 10 ms, the fallback time is the same as a peakmeter. The display’s reference point and resolution can be shifted for a clearer readout in the window. The RTA’s layer display is always relative.